<< Hide Menu
Karla Jauregui Sandoval
Karla Jauregui Sandoval
Age Structure Diagrams

Image Courtesy of Wikimeadia
An age structure diagram is a model that predicts the population growth rate by a shape. It shows a comparative ratio of males to females and the bars show various age groups from infants to adolescents to reproductive and post-reproductive stages. Certain age structure diagrams will have more representation at one end, while others will have more representation at the other end (or in the middle!).
- Pre-reproductive age: 0-14
- Reproductive age: 15-44
- Post-reproductive age: 45+ By using an age structure diagram, it can be predicted whether a population will increase, decrease or maintain stability. Predictions can also be made as to why this trend is showing: for example, is a population dying out because a majority of their individuals are above 45? The image below shows an age structure diagram for Ethiopia, and a classic example of a population in rapid growth. There are many more children in each generation than their parents, meaning that couples are having a lot of children. In this example the majority of the population is very young.

Image Courtesy of PopulationEducation
The diagram below shows New Zealand and an example of a population with stable numbers. This population has about the same amount of individuals in each age bracket. This suggests parents have access to reproductive education and can choose replacement level reproduction, or to have about two children per each couple.
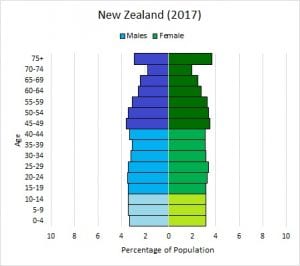
Image Courtesy of PopulationEducation
In conclusion, age structure diagrams help us visualize at which point a society currently is in terms of average age and how they may react given a change in birth/death rate.
© 2024 Fiveable Inc. All rights reserved.