<< Hide Menu
Harrison Burnside
Jenni MacLean
Harrison Burnside
Jenni MacLean
8.2 Human Impacts on Ecosystems
This is a complex section that covers a lot of ways in which humans have impacted systems. Let's start by looking at how humans monitor waterways for the impact of (primality) nonpoint source pollutants like excess fertilizers. 📝 Read: APES - 8.1 Sources of Pollution
Aquatic (Water) Pollution Monitoring
All aquatic organisms, plants 🥀 and animals 🐟, have preferred conditions for their optimal function. If these conditions are disturbed, then organisms will experience stress 😤 in some form. Stress causes impaired function, decreased individual growth, or reduced reproduction, and in extreme situations, organisms could die.
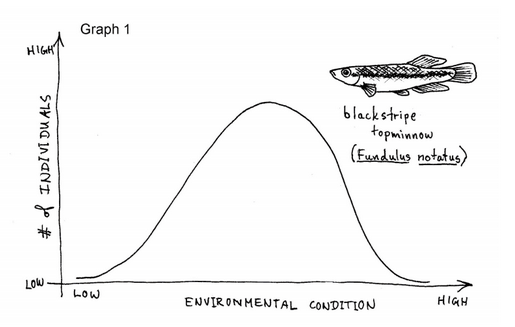
The Zone of Toleration describes how different abiotic factors may impact the ability of an organism to live in an ecosystem. These abiotic factors can vary from sunlight 🌅 to the amount of a pollutant in the water. The zone of tolerance graph looks like a bell curve 🔔 with the highest point in the middle. On both sides of the curve, the y-values approach zero. Some organisms naturally are able to tolerate a wider range of values than others. Often more sensitive spaces are called Indicator Species as they will be the first to disappear from an ecosystem under stress. Scientists tend to monitor these species and use their presence as a factor in determining the health of an ecosystem.

Zone of Tolerance Graph
Monitoring Water Quality
Some key factors that scientists measure to determine the health 🌡️ of an aquatic ecosystem are: dissolved oxygen, nutrient levels, and the presence of specific disease-causing organisms or toxins.
All of these parameters are interconnected and scientists are constantly monitoring bodies of water 🌊 that are frequently used, in order to protect human health 🤒, especially when using these bodies of water for recreation, drinking water 🚱, fishing 🐠, and other activities.
Dissolved oxygen (DO) is the amount of oxygen that is in the water 🚰 and available to organisms to carry out aerobic respiration. Cooler 🥶 waters have a higher capacity to hold dissolved gasses, such as DO, than warmer 🥵 waters.
DO is added to aquatic ecosystems via moving water 🌊 interacting directly with the air (like waves or a river flowing) and the oxygen from photosynthetic organisms ☘️ in the ecosystem. DO is removed from aquatic ecosystems by organisms consuming it during aerobic respiration 😷
Water Quality Trends to Know
| Overall Water Quality | BOD | DO | Temperature |
| 👍 | ⬇️ | ⬆️ | ⬇️ |
| 👎 | ⬆️ | ⬇️ | ⬆️ |
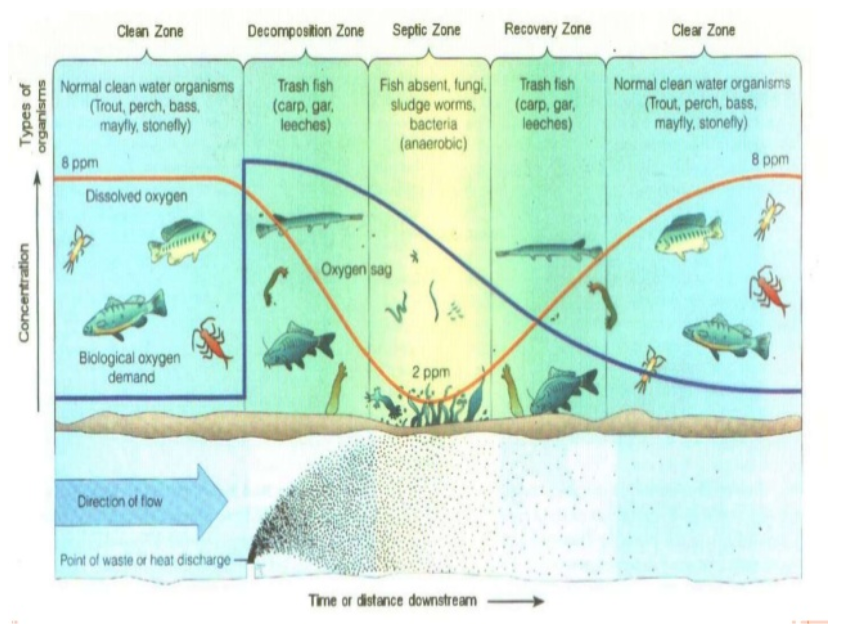
Measuring the biological oxygen demand (BOD) of an aquatic ecosystem can determine how much dissolved oxygen all of the organisms in the system need to survive and thrive. If the BOD exceeds the DO in the system, the ecosystem is considered to be hypoxic, or at an oxygen deficit 📉
BOD in an aquatic ecosystem can increase 🆙 if there is a large amount of organic waste that will be decomposed by microbes using aerobic respiration. If there is no DO in a body of water, it is anoxic.
The oxygen 🅾️2️⃣ sag curve is a plot of DO versus Distance from a Point Source Pollutant. The curve can also help you describe how much PPM (Parts per Million) of Oxygen 🅾️2️⃣ that different fish species need to survive!

Need more practice 😩 with this key topic? Check out APES 2015 FRQ #3 🧐 to practice what you learned! You can easily find the Problem ✍️ using the Past Prompts Database for APES:
AP Environmental Science 2015 Free-Response Questions
Major Pollution Events
Sometimes pollution events occur all at once. Probably the most well-known and disastrous events are large oceanic oil spills.
Deep Water Horizon Oil Spill
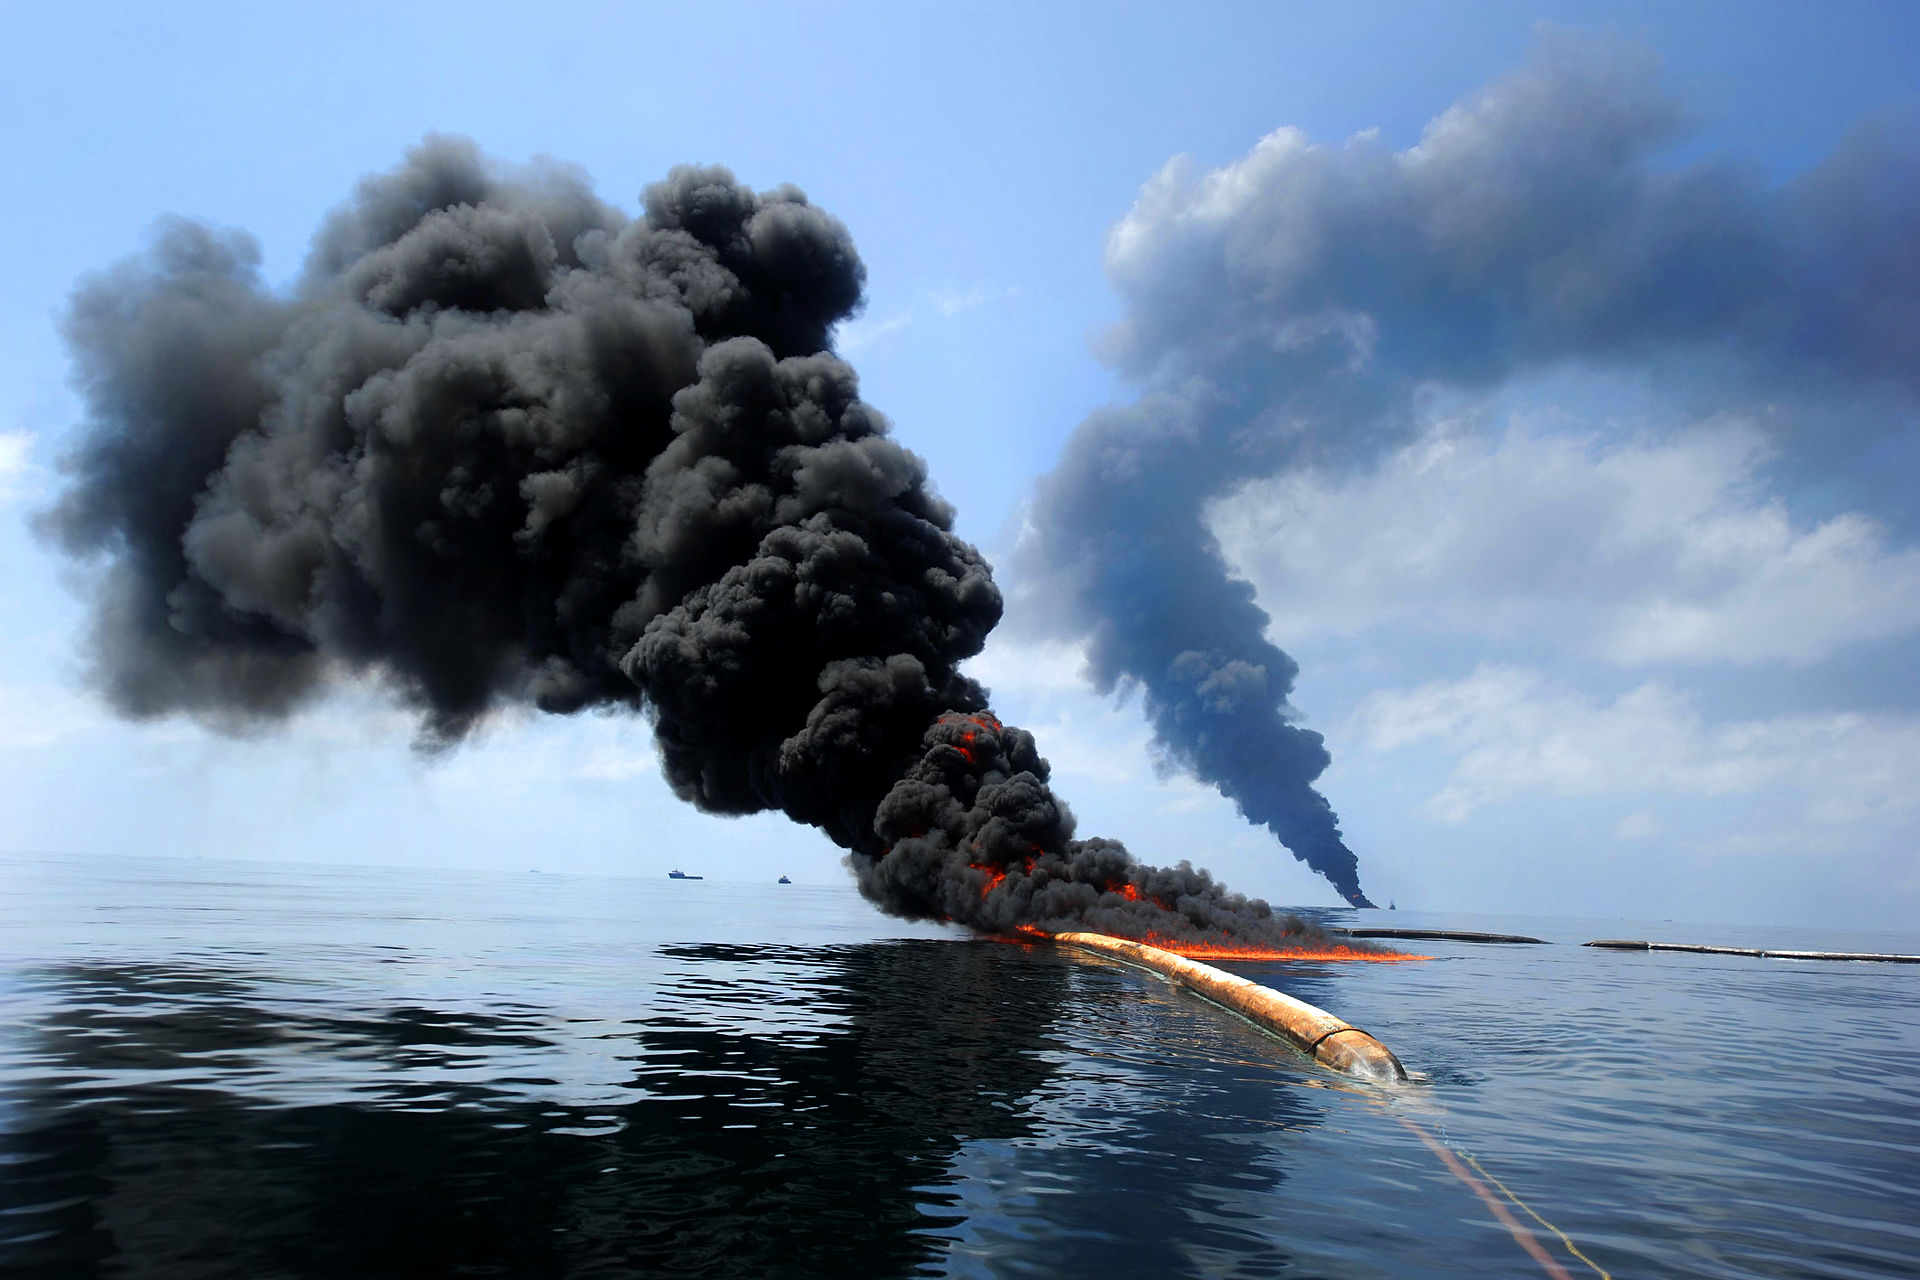
April 20, 2010, in the Gulf of Mexico, a drilling rig experienced catastrophic failure, resulting in the largest oil spill on record. Over 210 million gallons of oil flowed from the ground into the ocean before the mine could be sealed in September.

The massive amount of oil created an enormous environmental disaster, killing wildlife, impacting fisheries and tourism. To clean up the oil, millions of gallons of chemical dispersants 🧼were put into the water, as well as the use of controlled burns. As we learned when studying air pollution, 🔥 burning these fuels releases massive amounts of atmospheric carbon.
Exxon Valdez Oil Spill
On March 24, 1989, in the Prince William Sound off the coast of Alaska, a large oil 🚢 tanker, the Exxon Valdez, collided with the Blight Reef 🌊

The collision spilled 10.8 million gallons of oil into the Prince William Sound. The oil spread almost 500 miles off of the spill site to go on to stain thousands of miles of coastline 🏖️
The spill also greatly reduced the biodiversity 🐧 🦅 🐟 🦐 of the Sound. More than one hundred thousand (100k +) birds, fish, seals, otters, and other animals would perish as a result of the oil in the water 😭
Besides ecological effects, oil spills 🛢️ can have economic consequences where people are less inclined to visit the coastline and beaches 🏝️ because they are stained in oil. That means that Prince William Sound tourism money 💸 will fly away 👋[

© 2024 Fiveable Inc. All rights reserved.