<< Hide Menu
Jeanne Stansak
dylan_black_2025
Jeanne Stansak
dylan_black_2025
Circular Flow
The circular flow diagram is a graphical representation of how goods, services, and money flow through our economy between consumers and firms. There are two markets illustrated in the circular flow diagram: the factor (resource) market and the product market. The resource market is where factors of production (resources) are exchanged. The product market is where economic goods (products) and services are exchanged.
This diagram is based on the concept of voluntary exchange, the act of firms and consumers gathering freely in economic markets to achieve beneficial exchange in order to maximize their economic incentives. In the factor (resource) market, firms are demanding and consumers are supplying. In the product market, the consumers are demanding and firms are supplying.
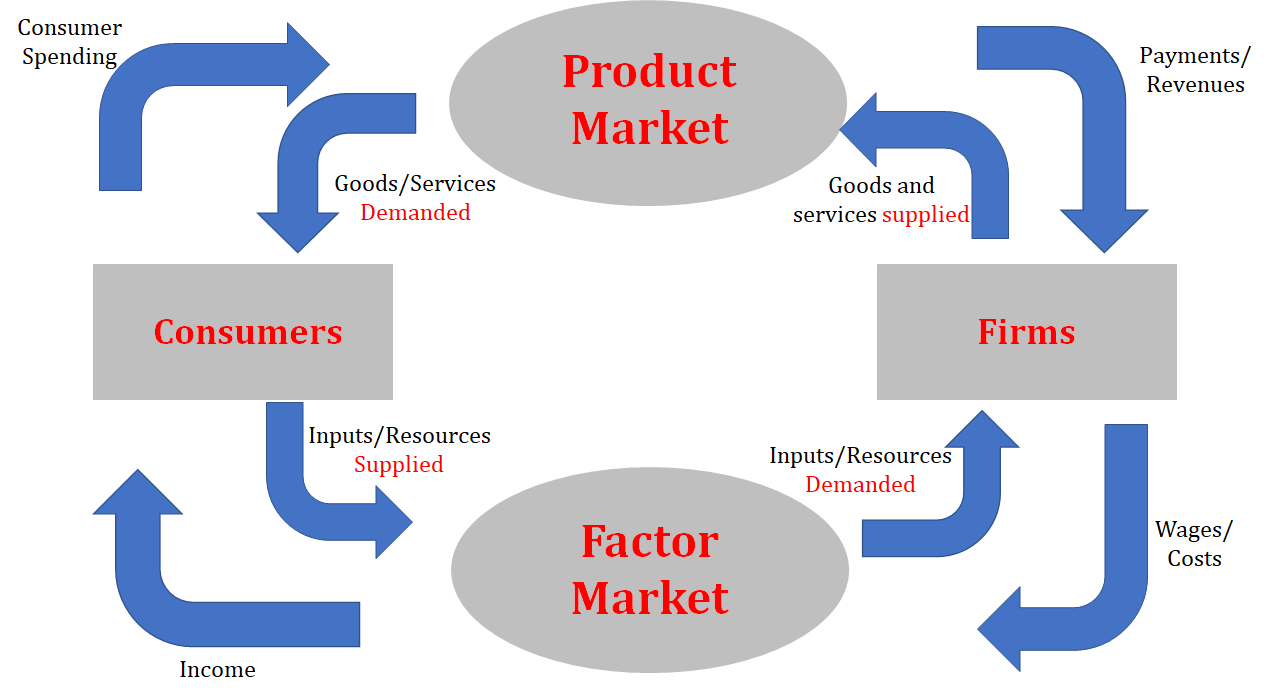
Below is a drawing of the circular flow diagram:

Let's break down each piece of the circular flow diagram.
Consumers
Consumers are the people buying goods in the economy. This means you, me, and everyone else around us are consumers. Consumers send money to the product market by buying goods. This is known as consumer spending. The product market gives consumers the goods that they demand. Consumers also interact with the factor market, in which they provide a factor of production, labor. They receive wages, or income, from the factor market.
Firms
Firms are the producers in the economy. Any business that produces a good is known as a firm. Firms receive factors of production, such as land, labor, and capital, from the factor market, and pay for them with wages or costs (wages for labor, costs for capital). Firms supply goods to the product market and receive payment for those goods.
Product Market
The product market is a market where firms sell the goods and services that they produce to households and businesses. In the circular flow diagram, the product market represents the exchange of goods and services for money between firms and households. The product market plays a crucial role in the economy, as it is through the sale of goods and services that firms are able to generate revenue and profits. The demand for goods and services in the product market is driven by households' and businesses' income and their willingness and ability to purchase these goods and services. The supply of goods and services in the product market, on the other hand, is determined by firms' ability and willingness to produce and sell these goods and services at different prices. The interaction between demand and supply in the product market determines the prices of goods and services and the quantity of goods and services that are exchanged.
Factor Market
The factor market is a market where factors of production, such as labor, capital, and land, are bought and sold. These factors are used by firms to produce goods and services, which are then sold to households in the goods market. In the factor market, households sell their labor, capital, and other resources to firms in exchange for income. Firms, in turn, use these factors of production to produce goods and services, which are sold to households and businesses in the product market.
Example Flow
Let's take a look at an example of the circular flow working all the way around in a couple of steps.
Let's suppose Jim is a consumer in the economy who wants to buy a computer. As we list the steps, look at the diagram to see which direction we're flowing.
The following steps will occur in the circular flow:
Jim is a consumer in the economy and he decides to purchase a computer from a store.
- This purchase takes place in the product market, where firms sell their goods and services to households like Jim.
- The store that sells the computer to Jim is a firm that produced the computer using various factors of production, such as labor, capital, and raw materials.
- To produce the computer, the firm purchased these factors of production from the factor market, where households and firms sell and buy resources like labor, capital, and land.
- The factor market pays Jim wages because he sells his labor to his job.
In this example, the circular flow starts with Jim as a consumer in the household sector, then moves to the product market where he purchases the computer from a firm. The firm obtained the resources needed to produce the computer from the factor market, and the flow ends back with Jim as a household in the economy.
GDP (Gross Domestic Product)
One of the most important measures of the economy is Gross Domestic Product, or GDP. GDP is the dollar value of all final goods and services produced within a country's borders in one year. GDP can be described as national income, and helps economists view how productive the economy is over time. We use GDP to compare ourselves to other countries, to see the impact of policy changes, and to compare our growth from year to year.
The two main methods of calculating GDP are the expenditures approach and the income approach. The expenditures approach is the sum of all aggregate spending on all final goods and services within a country's borders in one year.
Components of GDP
To calculate GDP, economists use four main components:
- **Consumer Spending—**the value of any good or service purchased by a consumer. Ex: Little Caesar's pizza, haircut, car tune-up, etc.
- **Investment Spending—**any spending done by businesses. Ex: money spent on tools and machinery. This is not an investment in the stock market or other investment vehicles.
- **Government Spending—**any spending done by the government. Ex: construction projects, military equipment, etc. This DOES NOT include welfare payments or other government assistance programs (ie. social security).
- **Net Exports (Exports - Imports)—**the value of all goods and services exported from a country added together with the value of all goods the country imports subtracted from this sum. Ex: the value of three Ford Focuses exported minus the value of two Honda Civics imported.
The Expenditure Approach
The expenditure approach is seen in the formula GDP = C + I + G + Xn where C is consumption, I is investment, G is government spending, and Xn is net exports. You may also see GDP = C + I + G + (X - N), where net exports is replaced with exports minus imports. It's called the expenditure approach because it sums all spending, or expenditures, in the economy.
The Income Approach
The income approach does the opposite of the expenditure approach, instead summing all of the incomes in the economy. Note that this should always equal the expenditure approach because all spending becomes someone else's income. The formula for the income approach is GDP = W + i + r + p where W is wages, i is interest payments, r is rents, and p is corporate profits. This formula is less common to see on the AP exam, but helps us understand how expenditures and incomes are related.
Sample Problem:

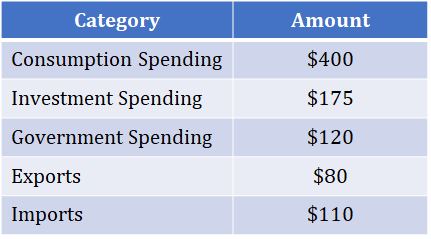
Using the data above and the expenditures approach we would calculate GDP by using the formula C + I + G + Xn. GDP equals 175 + 80 - 665.
What is Not Included in GDP?
There are several instances where an item is not included in GDP. Looking at the definition, anything that is not a final good or service produced within a country in a year does not count. Here are a few important ones to note:
Illegal activities: Transactions related to illegal activities, such as drug trafficking or gambling, are not included in GDP because they are not part of the legal market and are therefore not recorded.
Unpaid work: Unpaid work, such as volunteering or caregiving, is not included in GDP because it is not considered a market transaction.
Transfer payments: Transfer payments, such as social security benefits or unemployment insurance, are not included in GDP because they do not represent the production of goods and services.
Intermediate goods: Intermediate goods, which are goods that are used in the production of other goods and are not intended for final consumption, are not included in GDP. Only final goods and services, which are those that are consumed by households and businesses, are included in GDP. This is because intermediate goods are considered part of the production process and are not considered to be new production. An example of an intermediate good is a tire used in the production of a car. If we counted both the value of the tire and the car, we'd be double counting, since in theory the cost of the car should be the cost of all the materials used to make it.
Depreciation: The wear and tear on capital goods, such as machines or buildings, is not included in GDP because it is not a new production of goods and services.

© 2024 Fiveable Inc. All rights reserved.