<< Hide Menu
Jeanne Stansak
Haseung Jun
Jeanne Stansak
Haseung Jun
Aggregate Demand
Aggregate demand refers to all the goods and services that consumers, firms, and governments are willing and able to purchase at various price levels.
The difference between market demand and aggregate demand is that market demand shows the demand for one good/service at different prices, while aggregate demand shows the demand for all goods and services at different price levels. Instead of quantity, GDP is shown for the x-axis. This is because GDP measures production and not sales. Therefore, it would be accurate to put GDP for the x-axis.
The relationship between the price level and Real GDP output demanded is inverse. As the price level rises, consumers, firms, and government are less willing or less able to purchase the same quantity of Real GDP output and, therefore, end up buying less. As the price level falls, consumers, firms, government, and foreign consumers are more willing or more able to purchase the same quantity of Real GDP output and therefore buy more.
There are three reasons why the aggregate demand curve is downward sloping:
- **Real Wealth Effect—**Higher prices reduce the purchasing power of money and assets. Lower prices increase the purchasing power of money and assets. As purchasing power changes, the consumption of goods and services will change as well.
- **Interest Rate Effect—**Prices and interest rates mirror each other. As interest rates rise, firms take out fewer loans and invest less in themselves. As interest rates fall, firms take out more loans and invest in themselves more.
- **Foreign Trade Effect—**As prices rise domestically, exported goods and services become more expensive, and foreign consumers buy less. As prices fall domestically, exported goods and services become cheaper, and foreign consumers by more.
💡When prices increase, the aggregate real GDP output demanded decreases.
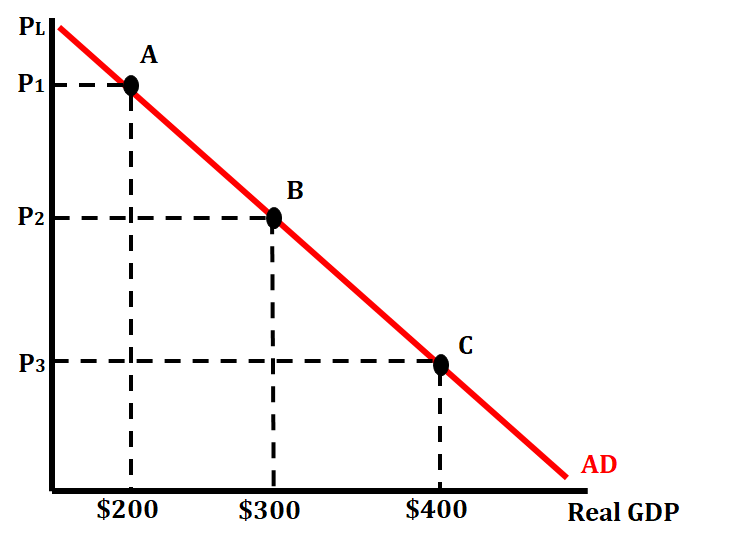
The graph above shows aggregate demand. You can see that, as price rises, real GDP decreases, and as price falls, real GDP increases. This law can be illustrated by showing how as price drops from P1 to P2 then real GDP increases from 300 and as price rises from P3 to P2, real GDP decreases from 300.
Just like with demand for an individual good or service, a change in price level moves us along the aggregate demand curve.
Shifters of Aggregate Demand
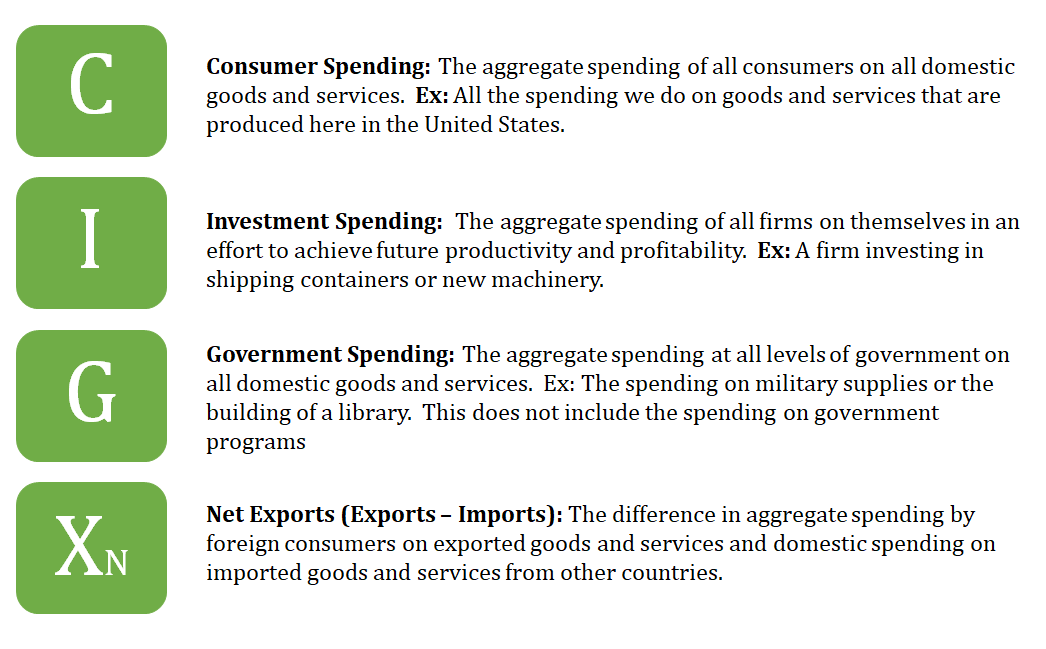
Just like demand for an individual good or service, there are factors that can increase aggregate demand (shift to the right) and that can decrease aggregate demand (shift to the left). These factors include all the components of GDP: consumer spending, investment spending, government spending, and net exports. Any changes due to price level have no effect on the AD curve.
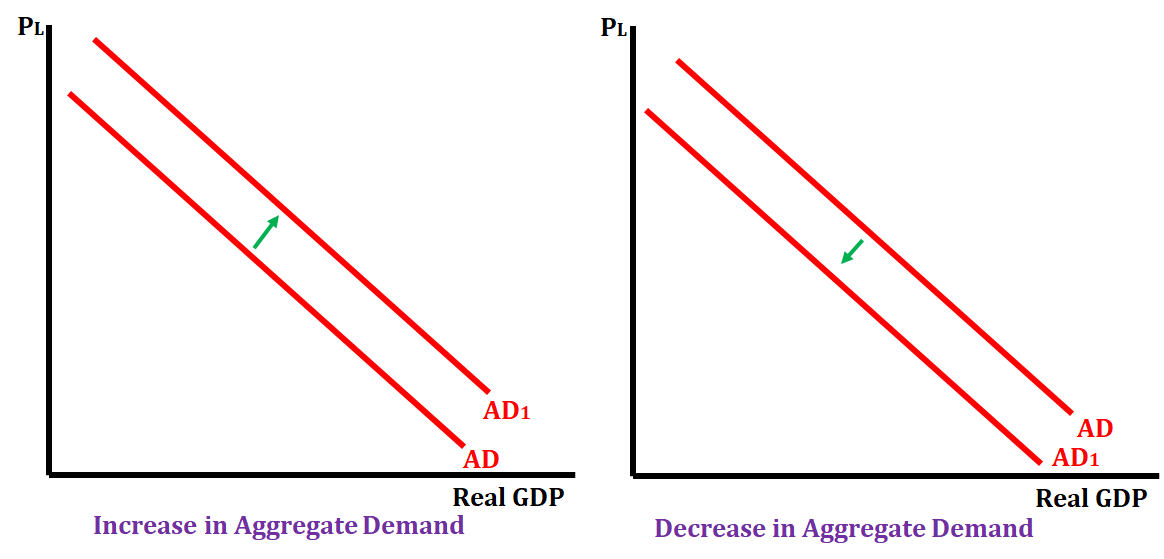
Each of the above factors can either increase aggregate demand or decrease aggregate demand. We show those actions on a graph by either shifting the aggregate demand curve to the right or shifting the aggregate demand curve to the left.
For each scenario below determine whether the scenario would increase or decrease aggregate demand and what factor is causing this to happen.
- South Korea consumer confidence soars.- Increase in Aggregate Demand due to an increase in consumer spending
- The British Government votes to shrink the size of its military.- A decrease in aggregate demand because there is a decrease in government spending since they are not spending as much money on their military.
- Due to severe drought, the China's inflation rate climbs by 4%.- This is a movement along the curve. The amount of real GDP will decrease because there is an increase in the price level (inflation).
- As the economy grows and profits increase, Italian firms begin to build more factories.- This would be an increase in aggregate demand because it is an increase in investment spending by firms in Italy.
- The US Congress removes a tariff on imported goods, making them less expensive.- This would be a decrease in aggregate demand because as imported goods become less expensive than we will see the amount of these goods purchased increase. Since the formula for net exports is exports - imports, when imports increase that number actually decreases which causes a decrease in aggregate demand.
© 2024 Fiveable Inc. All rights reserved.