<< Hide Menu
AP Microeconomics Multiple Choice Questions (MCQ)
6 min read•june 18, 2024
Dylan Black
Dylan Black
📝 How is the AP Micro MCQ Organized?
On the AP Micro exam, you'll be faced with two main parts: the multiple-choice section (MCQs) and the free-response section (FRQs). The multiple-choice section is the most significant section of the test, making up 66% of your score. On the exam, you'll be given 70 minutes (1h10m) to answer 60 questions from all 6 units of the course, everything from supply and demand to imperfect competition to market failures.
❓ What Kind Of Questions Can You Expect?
While there are no set types of questions, there are many different recurring themes throughout the multiple-choice section. We'll go over some super common types of questions and then give you some general tips for how to tackle the MCQ.
Recall Questions 💭
The first and most obvious type of questions are recall questions, which are simple definitions or rules. For example, a recall question might ask, "which of the following best describes GDP?" These questions may seem simple, but they can also trip you up if you don't know your material. You might get stuck between two very similar answers or second guess yourself, but with solid preparation and a little self-confidence, you can tackle recall questions with ease!
Here's an example of a recall question:
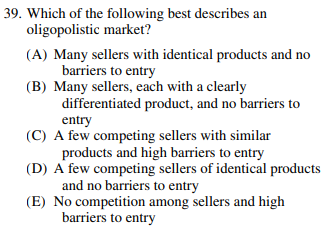
Image Courtesy of 2012 Public AP Micro Exam
For this question, there really is nothing you can do besides simply know what an oligopoly is. However, let's suppose you saw this question and went "oh no! I've completely forgotten about oligopolies, I'm absolutely getting this question wrong". Fear not! While these questions do require simple recall, there are strategies you can use to help your chances. These typically are your run of the mill MCQ tips - cross out distractors/blatantly wrong answers, narrow it down, and take your best guess.
For example, in this question, you can pretty quickly cross out (A) and (B) if you understand how imperfect competition works. In imperfect competition, the only market structure marked by a high number of sellers is monopolistic competition. Therefore, we can confidently cross out (A) and (B). This process can be repeated until you narrow it down.
The correct answer to this question is choice (C). An oligopoly is an imperfect market structure marked by few competing sellers that are interdependent on each others' actions (hence why when dealing with oligopolies game theory is such an important topic). As you can see, this question is just a simple definition.
Table Questions 🔡
The second type of AP Micro MCQs is "table questions". While these questions require a bit of straight knowledge, they also involve tables of typically two different indicators. These can be solved in your head, by graphing, or by any means that help you solve the problem. With these questions, in particular, there is no "best" way to approach them. If you have strategies that work for you, go for it! The most common form of this question typically involves a policy action followed by its effect on another few different measures.
Here's an example of a table question:
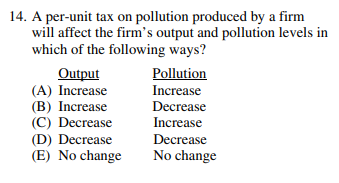
Image Courtesy of 2012 Public AP Micro Exam
This question presents you with a scenario - a per-unit tax has been placed on pollution produced by a firm. These questions can be particularly tricky not only in the economics of the question but also in the wording. You must make sure that you read the question carefully and know exactly what it's asking. If it had asked about a lump-sum tax rather than a per-unit tax, the answer could be completely different.
A solid strategy for these questions is to look at one column before addressing the next. This often allows you to knock out half of the answer choices. For example, let's suppose you knew exactly what'd happen to output, but not entirely sure what'd happen to pollution. In this instance, you can look at the answers for "output" and knock out two to three choices.
The correct answer for that column is that output will decrease because a per-unit tax will cause the supply curve to shift to the left, leading to a decrease in output. Even if you knew nothing about what happens to consumption, you've narrowed down your guesses to either (C) or (D), from a 20% chance to a 50% chance. We're not economists, but we'd take those odds over the old ones 😉.
From this point, you can either take a blind guess, or you can think a little deeper. Even if you don't have an exact rule on real interest rates' effect on spending, we can think realistically. If production goes down, logically thinking, pollution would decrease as well - production is simply lower. This isn't an economic realization, it is simply a logical following from our conclusion that output will decrease. Thus the correct answer is (D).
🎉 Tips and Tricks
When in doubt, graph it out!
Graphing is often a 🔑 trick to help answer MCQs on the AP Micro exam. Even though graphing is not required outside of the Free Response section, knowing how to quickly slap together a graph to see the impacts of policy/scenarios can save you. You don't have to make it pretty or label everything because it's just for you, but make sure you are drawing the right graph and understand the impacts of shifting curves.
Here's a question in which a graph would be helpful:
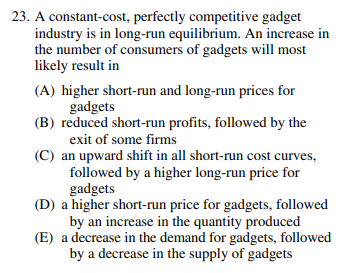
Image Courtesy of 2012 Public AP Micro Exam
Here's how I would graph this out:
Step 1: A constant-cost, perfectly competitive gadget industry is in long-run equilibrium
This is a simple perfect competition graph. To draw this graph, we need two things: a graph of the market and a graph of the firm. Remember, we are in long-run equilibrium, meaning we are at the point where MR = MC = ATC.
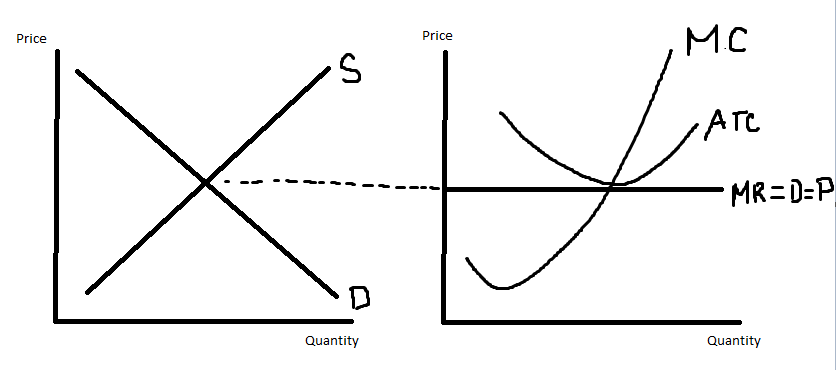
A nice, beautiful perfectly competitive firm. NOTE: Despite being slightly above, ATC is meant to touch the marginal revenue curve, just hard to draw 🙂
Above is the correct and fully labeled graph. This includes the market with supply and demand and the firm with MC, ATC, and MR=D=P. While things are missing like the profit-maximizing quantity and the equilibrium price and quantity, we can add those things in the next step. Note that in MCQ, your graphs don't have to be pretty like this! They can be scraggly and unlabeled as long as you know what you're doing and what each curve means.
Step 2: An increase in the number of consumers of gadgets
Next we see that there is an increase in the number of consumers of gadgets. This will translate on our graph as a rightward shift in the demand curve like so:
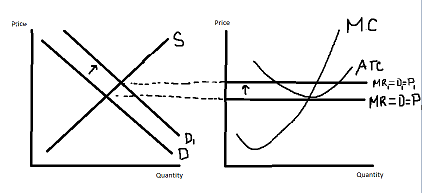
From this graph, the question becomes pretty simple. We see that in shifting demand right, the equilibrium price and quantity both increase for the market. Thus, because of the increase in equilibrium price, MR=D=P shifts up as well due to the fact that perfectly competitive markets are price takers. Thus, price increases in the short run and quantity in both the firm and market increase, thus the answer is (D).
Final Thoughts
We've laid out a bunch of information about the multiple-choice section on the AP Micro exam. These tips, along with knowing the content and formatting of the exam/questions, can help you immensely on your journey to a 5. However, there is one thing I have yet to mention that, if not done, makes these tips near useless.
PRACTICE. PRACTICE. PRACTICE.
Practicing MCQs is the surefire way to gain content knowledge, know the questions, and be confident in yourself! If there is one thing that I want you to take away from this, it's that practice makes perfect. You're going to destroy the exam and do absolutely amazing!! You've got this, happy studying! 🎉

© 2024 Fiveable Inc. All rights reserved.