<< Hide Menu
2.6 Market Equilibrium and Consumer and Producer Surplus
5 min read•june 18, 2024
Jeanne Stansak
dylan_black_2025
Jeanne Stansak
dylan_black_2025
Introduction
In this unit, we've discussed how a market is a social structure that brings together producers, AKA suppliers, and consumers, AKA demanders. We've also modeled their activity by using a demand curve for consumers and a supply curve for producers. However, we haven't actually modeled a market yet. This is because we have yet to bring consumers and producers together! This guide will go deep into how a market actually decides how much to produce and at what price.
What is Equilibrium in a Market?
Market equilibrium is a condition in a market where the quantity supplied equals the quantity demanded at an optimal price level. It is the point at which all of the quantity supplied is consumed by consumers who are willing and able to. This occurs where Qd = Qs, or where the demand curve intersects the supply curve (note that this is only ever one point, because demand is monotonically decreasing whereas supply is monotonically increasing).
This occurs as a result of voluntary exchange. Voluntary exchange is the act of consumers and firms mutually benefiting in the marketplace, as utility and profits are maximized.
When a market is in equilibrium, it is allocative efficient (when we are meeting the needs of society), and the sum of consumer and producer surplus, or total economic surplus, is maximized. This is shown by the graph below at the point where the quantity demanded equals quantity supplied (Q1).
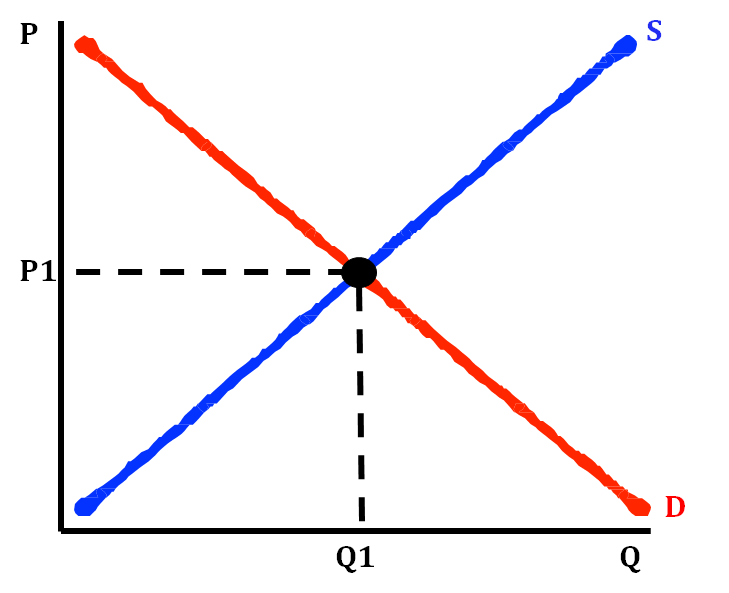
Q1 and P1 are known as the equilibrium price and quantity for this market. When suppliers supply this quantity at this price, all of their quantity will be consumed by consumers in an efficient manner.
Consumer Surplus
Consumer surplus is the difference between the total amount that consumers are willing to pay for a good or service and the total amount that they actually pay. There are two types of consumer surplus:
- Individual consumer surplus is the difference between a buyer's maximum price (highest price that they are willing to pay for a good or service) and what the market price is.
| Buyer's Maximum Willingness to Pay | Individual Consumer Surplus |
| $12 | $4 |
| $11 | $3 |
| $10 | $2 |
| $9 | $1 |
| $8 | $0 |
In the table above, the left-hand column shows all the various prices that individuals are willing to pay for a particular good or service. The right-hand column shows you what their individual consumer surplus would be if they paid the equilibrium price, which in this situation is 12 and ends up paying 4 that they did not have to spend and this is a consumer surplus, or extra money, they have left to spend on something else.
- Total consumer surplus is all the individual consumer surpluses added together. This is identified on a supply and demand graph as the triangle above equilibrium price (the green area on the graph below). Total consumer surplus is always the triangle above the equilibrium price because it shows all the various prices above equilibrium that consumers would be willing to pay above the market price. For example, if an iPhone is selling for 300, which is demonstrated by all the different price points on the section of the demand curve that is above equilibrium price. We use consumer surplus on a graph to illustrate all the various prices people are willing to pay for an iPhone.
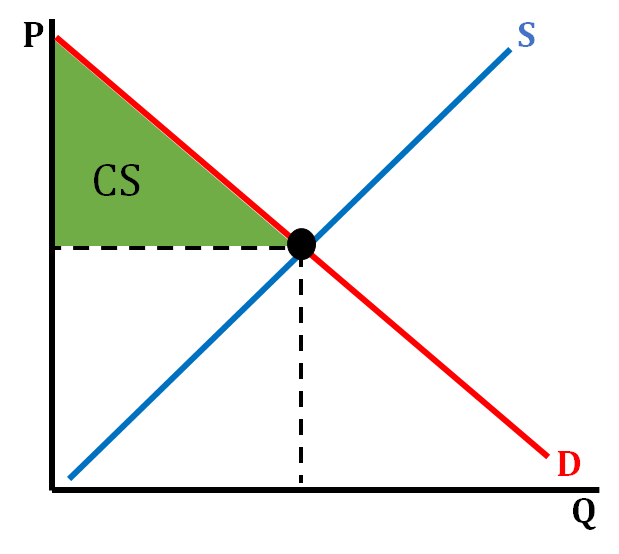
On the graph above, we show how we represent consumer surplus on a standard demand and supply graph. In many situations, consumers are willing to pay more for a good or service than what is being charged in the market, so we shade the triangle above equilibrium price that goes up to the demand curve.
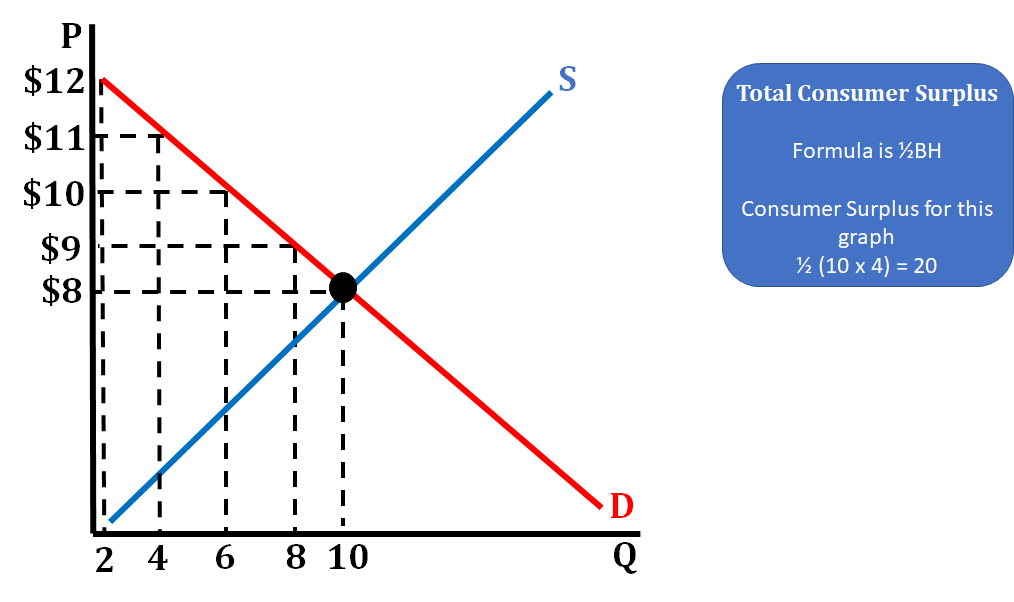
💡 Use the triangle area formula from math to find the consumer surplus on a graph!
📈 For those of who are mathematically inclined and know some calculus, try seeing how you would find consumer surplus with non-linear supply and demand! Hint: You'll need to know how to integrate!
Producer Surplus
Producer surplus refers to the difference between the total amount that firms are willing and able to sell a good or service for and the total amount that they actually receive when selling it. Individual producer surplus is the difference between a firm's (seller's) minimum price and the equilibrium price that the good or service is sold for in the market.
- Individual producer surplus is the difference between a firm's (seller's) minimum price and the equilibrium price that the good or service is sold for in the market.Assume that the equilibrium price in the market is $9 per unit.
| Seller's Maximum Willingness to Pay | Individual Producer Surplus |
| $1 | $8 |
| $3 | $6 |
| $5 | $4 |
| $7 | $2 |
| $9 | $0 |
In the table above, the left-hand column shows all the various prices that firms are willing to sell their particular good or service for. The right-hand column shows you what their individual producer surplus would be if they paid the equilibrium price, which is 10,000, while you negotiate a price of 4,000 more for the car than anticipated, which is their producer surplus.
- Total producer surplus is composed of all the individual producer surpluses added up. This is identified on a supply and demand graph as the triangle below equilibrium price (the blue area on the graph below). Typically, a firm has a lower than equilibrium price they are willing to accept for a product. If they receive a higher price, that becomes surplus for them. For example, when you walk into a clothing store and buy a pair of jeans for 25 they received extra money above this price.
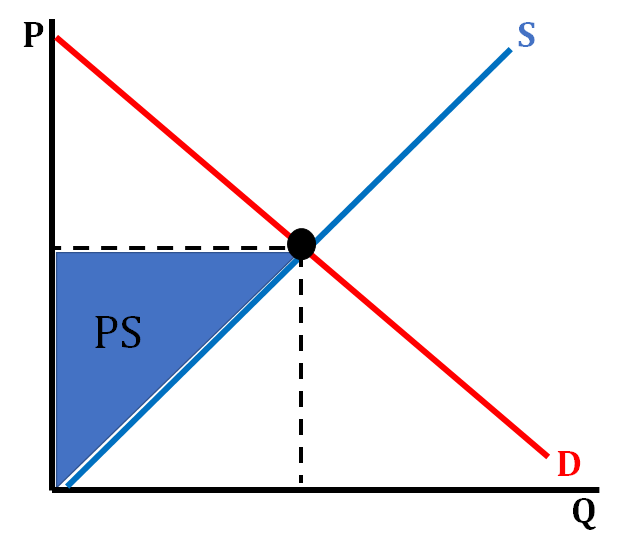
The graph above shows how we represent producer surplus on a demand and supply graph. Since producer surplus is the difference between what price the producer is willing to sell their product for and what they actually sell it for, we shade the area below equilibrium but above the supply curve.
💡Use the triangle area formula from math to find the producer surplus on a graph!
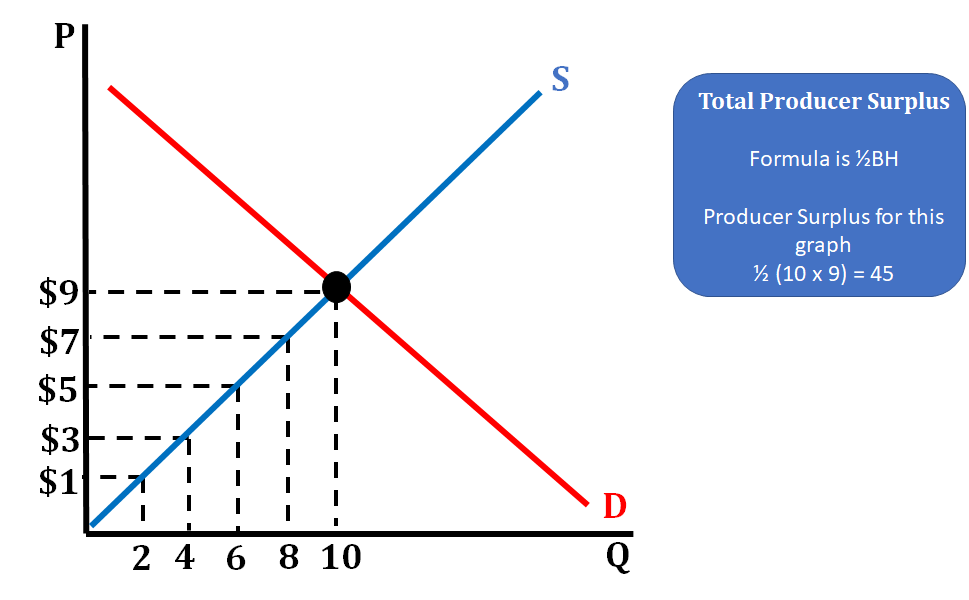
This graph shows a product with an equilibrium price of $9 and shows all the other prices firms are willing to sell the product for. This allows us to calculate how much the producer surplus is for this market, a task that is common on the AP exam. In economics, CS and PS allow us to measure the efficiency of a market and demonstrates the benefits that both producers and consumers receive.
© 2024 Fiveable Inc. All rights reserved.