<< Hide Menu
6.1 Socially Efficient and Inefficient Market Outcomes
4 min read•june 18, 2024
Jeanne Stansak
dylan_black_2025
Jeanne Stansak
dylan_black_2025
Introduction
In microeconomics, we often consider the social benefits and social costs of producing and consuming goods and services. This is because the production and consumption of these goods and services have impacts on society as a whole, not just the individual producers and consumers. For example, consider a factory that produces cars. The individual producers of the cars may receive financial benefit from the production, but the negative externalities, such as air pollution, may also impose costs on society. As a result, it is important to consider both the benefits and costs to society when making economic decisions. In this study guide, we will explore the concepts of marginal social benefit and marginal social cost, and how they can be used to understand the trade-offs and efficiency of economic decisions.

Does producing this car help or hurt society? In this unit you'll be able to explain why both may be correct!
What is a Socially Optimal Outcome?
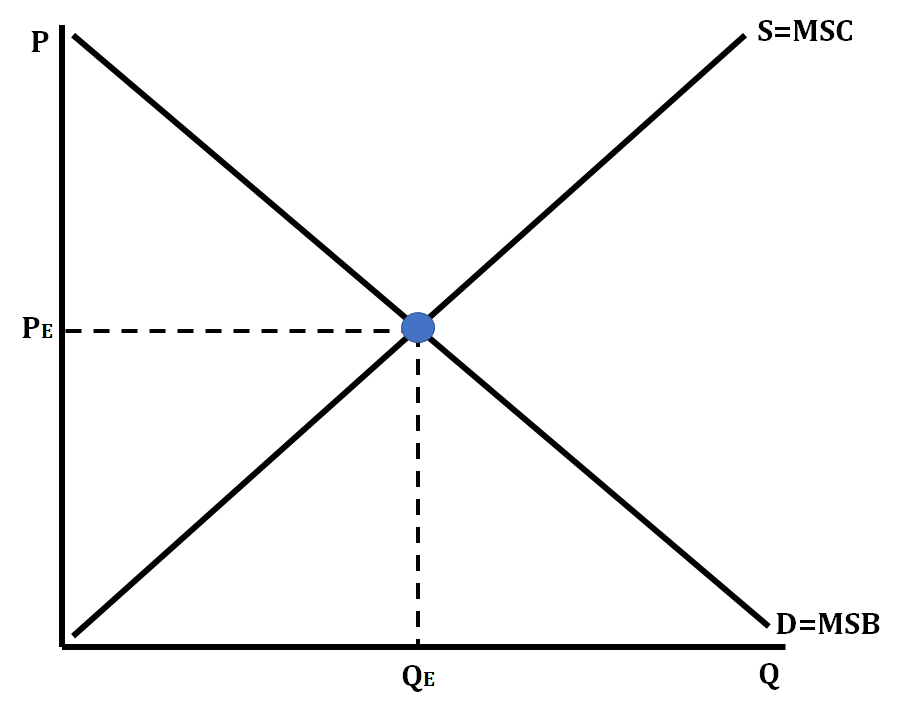
Socially efficient market outcomes are the optimal distribution of all resources in society while taking into account all internal and external costs and benefits. In our study of economics, socially efficient takes place where marginal social benefit (MSB) = marginal social cost (MSC).
Marginal Social Benefit and Marginal Social Cost

Marginal Social Benefit
Marginal Social Benefit (MSB) is the additional benefit received by all members of society due to the consumption of an additional unit of a good or service. This includes both those who directly benefit from consuming the foods, and those who receive spillover benefits, or external benefits experienced by third parties, from consumption.
The marginal social benefit curve represents the benefit to society of consuming an additional unit of a good or service. It slopes downward because as more units of a good or service are consumed, the marginal benefit to society from consuming each additional unit decreases. This is due to the concept of diminishing marginal utility, which states that the more units of a good or service an individual consumes, the less additional satisfaction they receive from consuming each additional unit. As a result, the marginal social benefit of consuming additional units of a good or service decreases as the quantity consumed increases, leading to a downward slope in the marginal social benefit curve.
Marginal Social Cost
Marginal Social Cost (MSC) is the additional cost incurred by all members of society due to the consumption of an additional unit of a good or service. This includes both the private cost paid by the producers along with spillover costs, which are external costs faced by third parties.
The marginal social cost curve represents the cost to society of producing an additional unit of a good or service. It slopes upwards because as more units of a good or service are produced, the negative externalities (e.g. pollution, congestion) associated with production become more significant, causing the marginal social cost to increase. In addition, as the number of units produced increases, the opportunity cost of using scarce resources for production also increases, leading to an upward slope in the marginal social cost curve.
Socially Optimal Quantity: MSB = MSC
When you are producing at the quantity and price level where MSB = MSC, you are producing at the socially efficient point. At this point, we maximize all economic surplus. If you choose a quantity on either side of the equilibrium quantity, you are producing an inefficient quantity, and it will result in deadweight loss.
As with most of our Marginal X = Marginal Y rules, this can be explained using the cases when MSB > MSC and MSB < MSC.
When MSB > MSC, we still have benefit to gain, so we should keep producing. If we produce where MSB > MSC, we are underproducing.
If MSB < MSC, than each additional quantity consumed costs society more than it gains. In this case, we are overproducing.

In the above graph, we have an efficient allocation of resources, since MSC = MSB. There's some additional notation in this graph of MPC and MPB. These are the marginal private cost and marginal private benefit. These will be more relevant when we talk about externalities, where there are excess social costs or excess social benefits and as such they aren't the same as the costs and benefits to the private sector.
Inefficient Market Outcomes
In the graph above, if we were to produce either at a quantity above or below the equilibrium, we would be producing at an inefficient point where we are either underproducing or overproducing the good or service. This is known as a market failure. At these points, our MSB is not equal to MSC, meaning we either have excess benefit and the market is underproducing or we have excess costs. The government sometimes has to take action or make policies to correct these inefficiencies. For example, let's look at the market for education:

As we can see, the marginal social benefit is larger than the marginal private benefit. This is because, while education may not bring in tons of money, it is very useful for society (can't have society without education!). This is called a positive externality. The market will produce where quantity supplied equals quantity demanded, which is Q* on this graph. However, the socially optimal outcome is at Q, where MSB = MSC. Thus, the market is underproducing. This leads to deadweight loss in the graph that we'll discuss in the next section.

© 2024 Fiveable Inc. All rights reserved.