<< Hide Menu
6.9 Justifying a Claim Based on a Confidence Interval for a Difference of Population Proportions
2 min read•june 18, 2024
Josh Argo
Jed Quiaoit
Josh Argo
Jed Quiaoit
Interpretation
When interpreting a confidence interval for the difference in two population proportions, we need to show that the bounds given by the confidence interval give us an estimate of what the difference in our two population proportion are within. Our interpretation and interval is also strongly based on what our confidence level is. The standard confidence level is 95%.
When completing a confidence interval on the AP Statistics Exam, you will generally be graded on if you included the following three components:
👉 Including confidence level (given in problem)
👉 Including that our interval is making inference about the difference in population proportions, not sample proportions.
👉 Including context of the problem.
If you do these three things and get the correct answer, you will be on your way to 💯.
Testing a Claim
When you construct a confidence interval for the difference between two population proportions to test a claim, you want to see if 0 is included in the interval. 🌈
- If it is, it means that there is a reasonable level of uncertainty about whether the two population proportions are different, and you cannot (or fail to) reject the null hypothesis that there is no difference between the two proportions.
- If 0 is not included in the interval, it suggests that the two population proportions are likely different, and you can reject the null hypothesis in favor of the alternative hypothesis.

Image Courtesy of cbssports
Example
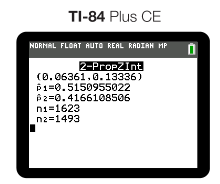
Recall from Unit 6.8 we constructed a confidence interval for the difference in proportions for shots made for Michael Jordan and Lebron James. We got the following output from our calculator: 🏀

A correct way to interpret this would be:
"We are 95% confident that the true difference in the population proportions for shots made between Michael Jordan and Lebron James is between (0.063, 0.133). Since 0 is not included in our interval, we have reasonable evidence that the two population proportions are actually different"
So it appears that MJ is better than Lebron. ¯_(ツ)_/¯
However, some things to note here is that we took a sample from both of their first seasons. If we refer back to basketball-reference.com and compare the two players 10th seasons in the league, we might find a VERY different result. Another possible confounding variable is the teammates these two players have been surrounded by throughout their career.
🎥 Watch: AP Stats - Inference: Confidence Intervals for Proportions

© 2024 Fiveable Inc. All rights reserved.