<< Hide Menu
Kashvi Panjolia
Kashvi Panjolia
Similar to graphing functions in the Cartesian plane, you can polar functions on the polar plane. Remember that the polar plane represents points in the plane based on their distance from the origin (0,0) and the angle they make with the positive x-axis.
Polar Functions
Polar functions are equations written in the form r = f(θ), where r is the radial distance from the origin and θ is the angle. Their graphs consist of input-output pairs of values where the input values are angle measures and the output values are radial distances.
In the Cartesian coordinate plane, the equation y = x creates a line that passes through the origin (0, 0) and has a slope of 1. This means that for every unit increase in x, there is a corresponding increase of the same amount in y.
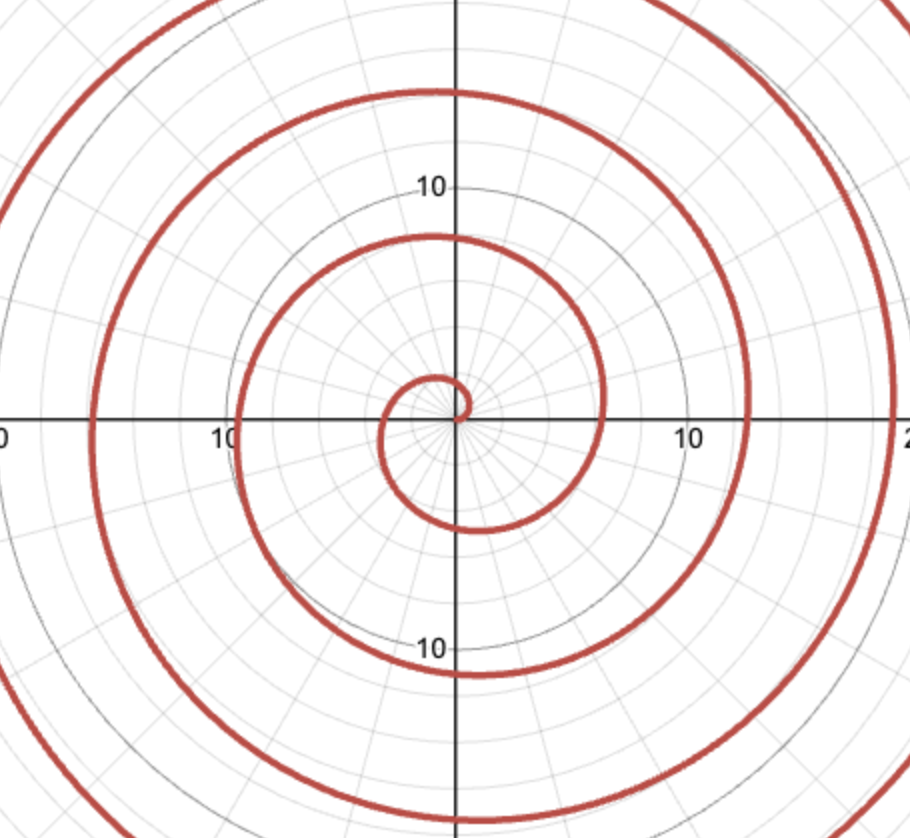
In the polar coordinate plane, however, the equation r = θ creates a spiral that starts at the origin and spirals outward. In polar coordinates, r is the distance from the origin and θ is the angle relative to the positive x-axis. As θ increases, r also increases, causing the points to spiral outward away from the origin.

A graph of the function r = θ.
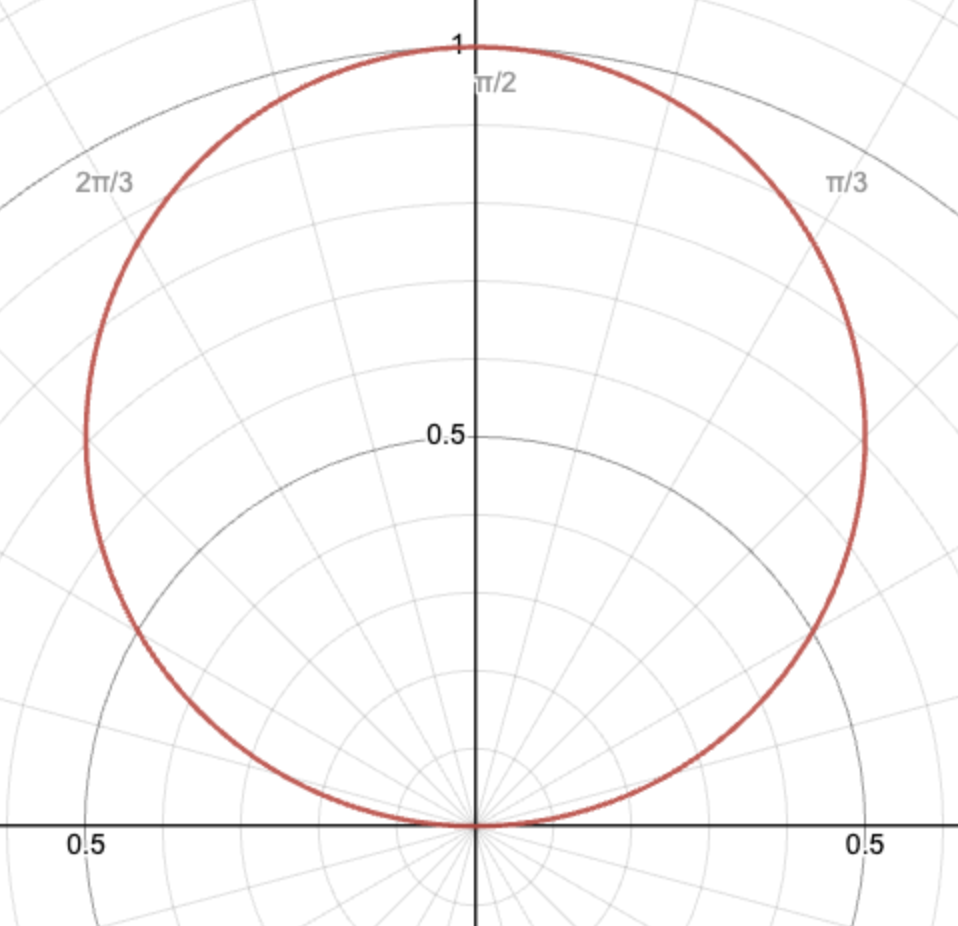
It is possible to shift or scale this function, but you would still be graphing a spiral. That's why, in order to graph different kinds of functions, trigonometric functions are used inside polar functions. For example, the graph of r = sinθ creates a circle touching the origin.

A graph of the function r = sinθ.
Graphing Polar Functions
The process for graphing polar functions is very similar to the process for graphing any function. It may seem a little tedious, but it is essential you follow this process for accurate and thorough graphs. These are the steps for graphing a polar function:
- Determine the domain and range of the function: The first step in graphing a polar coordinate function is to determine the range of values for both r and θ. This will give you the domain and range of the function, which will in turn determine the size and shape of the graph.
- Choose a set of values for θ: Once you have determined the domain and range of the function, you can choose a set of evenly spaced values for θ. This could be any set of values that covers the entire domain of the function, such as 0° to 360° in increments of 30°.
- Evaluate the function at each value of θ: Using the set of values for θ, you can evaluate the function at each value to determine the corresponding values of r. For example, if your function is r = f(θ), you can use the formula r = f(θ) to find the values of r for each value of θ.
- Plot the Points on the Graph: Once you have found the values of r for each value of θ, you can plot these points on a polar coordinate graph. To do this, you can use polar coordinates to plot each point, with the radial distance from the origin representing the value of r and the angle from the positive x-axis representing the value of θ.
- Connect the Plotted Points with a Smooth Curve: Finally, you can connect the plotted points with a smooth curve to form the graph of the function. This will give you a visual representation of the function and help you see its shape and behavior.
Here is an example question to help you understand how to graph a polar function:
Graph the polar function r = 2cosθ from θ=0 to θ=𝛑.
We will make a table of values for θ and r from θ=0 to θ=𝛑, incrementing θ by 𝛑/6 radians for accuracy. To do this, we substitute our θ values into r = 2cosθ and simplify to find r for each value of θ:
| θ (radians) | r = 2cosθ |
| 0 | 2 |
| 𝛑/6 | √3 |
| 𝛑/3 | 1 |
| 𝛑/2 | 0 |
| 2𝛑/3 | -1 |
| 5𝛑/6 | -√3 |
| 𝛑 | -2 |
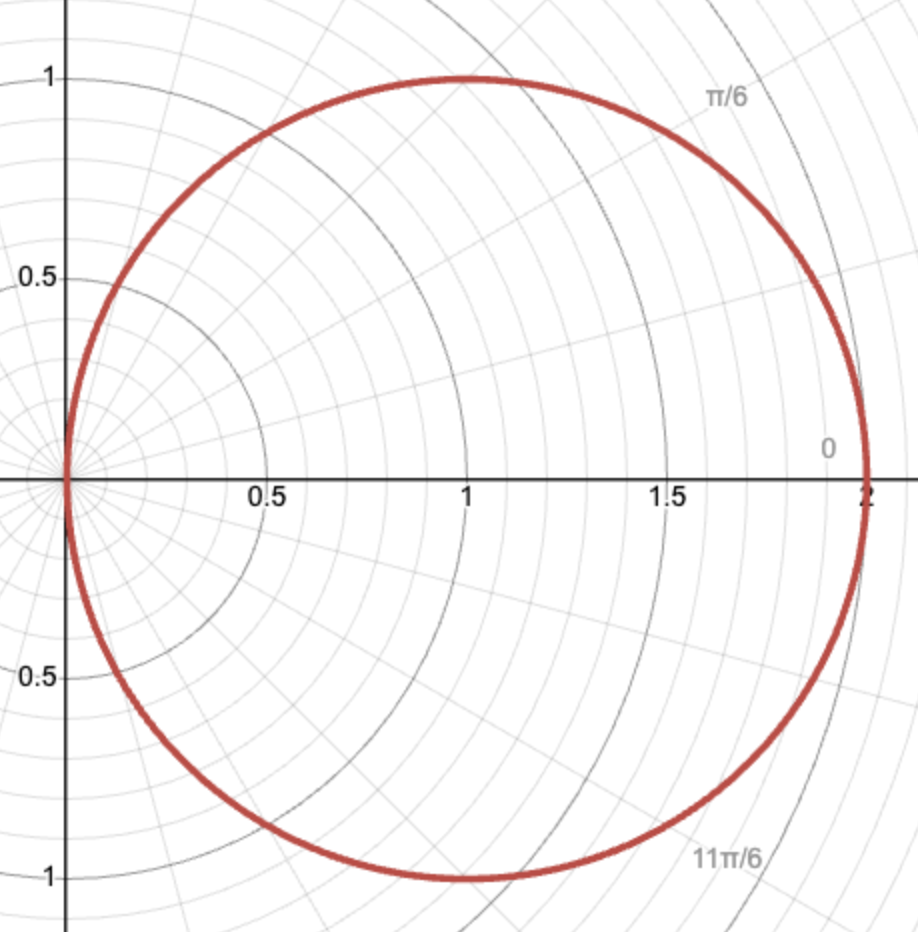
Using our table, we will plot these coordinate points on the polar plane and connect our points to obtain a smooth curve. The graph of the function r=2cosθ from θ=0 to θ=𝛑 is shown below.

This graph is a circle touching the origin because of an important property of the polar plane. One point can be represented by multiple sets of coordinates, so (2, 0) and (-2, 𝛑) are referencing the same point (remember that in the polar plane, coordinates are written using the form (r, θ)).
The polar plane is different from the Cartesian plane because the changes in input values (θ) correspond to changes in the angle measure from the positive x-axis, and changes in output values (r) correspond to changes in distance from the origin. In the Cartesian plane, the changes in the input values (x) led to changes in the horizontal distance from the origin, and the changes in output values (y) led to changes in the vertical distance from the origin. Be sure to practice graphing more polar functions so you can wrap your head around this concept.
Key Features of Polar Function Graphs
One of the key features of polar function graphs is symmetry. A polar function is said to be symmetric about the origin if its graph is unchanged when reflected about the origin. This means that the graph of a polar function is symmetric if it looks the same when rotated by 180°.
Another important feature of polar function graphs is periodicity. A polar function is said to be periodic if its graph repeats after a fixed interval of θ. This means that if you start at a point on the graph and rotate the graph by a fixed angle, you will end up back at the same point on the graph. This feature was demonstrated in the example above. After 𝛑 radians, the function mapped to the same point on the polar plane as it did when 0 radians was substituted as the angle.

© 2024 Fiveable Inc. All rights reserved.